Instructions:
Welcome to psAquaFarm, your chance to make big bucks raising fish and solving world hunger using dependent and independent variables. How does it work? Glad you asked! Click on this link to the simulator and follow these simple instructions:
![]()
We start with Rainbow Trout, a great tasting fresh water fish that grows well in ponds. For a second round of experiments (in two weeks), you will be working with a Mystery fish. You will not change the species for the first series of simulations.
The Mystery Fish (species Alpha, Beta, Gamma, and Delta) each require particular levels of oxygen and protein content, and can tolerate different levels of crowding. For the species you are assigned, you will find the optimum values for each variable, using problem solving methods you developed and refined in your previous work with the Rainbow Trout. You can conclude that species requiring higher levels of protein, for example, feed primarily on insects and other fish in the wild. Other fish do not grow to a very large size, so those species are rarely profitable in low densities. As another example, some fish are found in small ponds and lakes where they find abundant food but little oxygen. Think about how these different biological requirements could be met by adjusting the values of the three variables in this simulation. Work across the widest possible range of values for each variable as you start seeking the optimum values when working with the Mystery Fish.
Step
2: Make Adjustments to One Value:

Step 3: Press the "Run Simulation" button
![]()
Step 4: Change One Value and Repeat Experiment:
Last Step: Copy values

-
Using the mouse, click and drag to select the contents of the table
-
Using the keyboard, press the Ctrl key, and while stil pressing Ctrl, press the C key (this copies the selected text to the computer's clipboard).
-
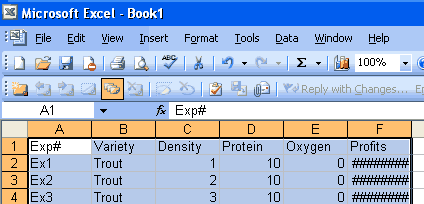
Open Microsoft Excel
-
From the Edit menu, select "paste" to transfer the data to Excel

Note: you can fix the readout of the profits by making the column longer.