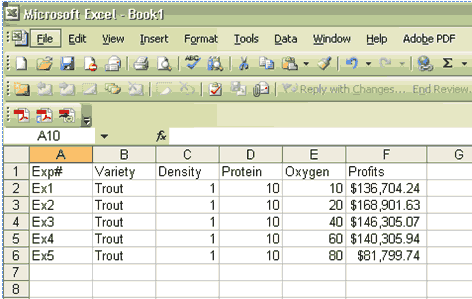
Recording Your DataOne of the most important skills of a problem solver is to carefully record observations and data. Using this simulation, you will be able to copy and paste your data easily into a worksheet. While this is an easy step, it is critical that you include some labels or notes that will help you remember what you were examining. Here are some hints. For each set of experiments you run, you should clearly identify the variable you are examining (the manipulated variable, also called the "independent variable") as well as the variables you are keeping constant for the time being (the controlled variables). When you copy and paste your data into a worksheet, you will automatically record the value at which you are keeping the controlled variables constant. For example, if you are examining protein content, you will be trying a range of values for that variable, but at the same time you will be holding stocking density and dissolved oxygen constant. What are the values you will be holding for those controlled variables? The values should be moderate, not too high or too low, or they should be the optimum value you've identified in a previous set of experiments. On your graphs, you will be asked to record the values for the controlled variables. You need to write those values on your data sheets so that when you print your graphs you can include those values on the graphs as well. Your worksheets should look something like this as you get started:
|
